
Pre-Earnings Brief - Micron Technology (MU) - Jun 22, 2026
Editor's Notes:
- As Micron Technology prepares to report its third-quarter fiscal 2026 results, the market is no longer treating the company as a volatile, commodity-bound memory maker. Instead, a fundamental narrative shift has taken root: Micron is being priced and analyzed as a core, non-fungible AI infrastructure utility. With the stock up nearly 19.4% over the past two weeks and trading near all-time highs of $1,134, institutional expectations have reached a fever pitch.
Part 1: The Macro Narrative — The Death of the Memory Cycle
The historical bear case against the semiconductor memory sector was straightforward: high prices always cured high prices. Whenever margins peaked, manufacturers overbuilt capacity, leading to inventory gluts, price wars, and massive capital destruction. However, the AI-driven High-Bandwidth Memory (HBM) supercycle has broken this traditional playbook due to three structural factors:
- The Wafer Penalty: Producing next-generation HBM3E and HBM4 requires roughly four times (4x) the silicon wafer capacity of standard DDR5. This means that even as Micron and its peers aggressively build out capacity, the net supply of usable memory bits is severely constrained. Manufacturers are running hard just to keep total bit shipments flat.
- Strategic Customer Agreements (SCAs): Micron has locked in its entire HBM capacity through calendar 2026 via fixed-price, multi-year capacity reservations with major hyperscalers. This structural shift from highly volatile spot-market transactions to predictable, long-term contracted volume provides cash-flow visibility never before seen in the memory sector.
- The Apple Pricing Inflection Point: Tim Cook’s recent admission that elevated memory chip costs have become "unsustainable" is a watershed moment for supply-chain dynamics. Apple has historically used its immense purchasing power to squeeze margins out of its component suppliers. The fact that Apple must now raise device prices to protect its own margins proves that hyper-profitable server demand has completely stripped hardware brands of their traditional buyer leverage.
Part 2: Detailed Segment & Product Breakdown
Micron operates through four distinct business units. Under the current cycle, we are witnessing an aggressive, structural shift in the product mix toward high-margin cloud and data center segments, leaving traditional consumer categories behind.
Table 1: Revenue Mix Comparison (FY2025 vs. FQ2-26)
| Category | FY2025 (Annual) | FQ2-26 (Quarterly) |
By Product Segment | ||
DRAM | $28.58B | $18.77B |
NAND | $8.50B | $5.00B |
Other | $0.30B | $0.10B |
By Business Unit (BU) | ||
Cloud Memory (CMBU) | $13.52B | $7.75B |
Core Data Center (CDBU) | $7.23B | $5.69B |
Mobile & Client (MCBU) | $11.86B | $7.71B |
Automotive & Embedded (AEBU) | $4.75B | $2.71B |
Commentary: The transition is stark. The Core Data Center (CDBU) segment alone brought in $5.69B in FQ2-26, representing a massive sequential increase of 139% over previous run-rates. This shift directly underpins the company's margin expansion.
Part 3: Financial Scorecard & Valuation Baseline
To understand Micron's trajectory, we must analyze its recovery from the severe cyclical trough of 2023 into the current high-margin expansion phase.
Table 2: Annual Performance (3-Year Trend)
| Fiscal Year | Revenue | Operating Margin | ROIC | Free Cash Flow (FCF) | DIO (Days Inventory Outstanding) |
FY2023 | $15.54B | -33.4% | -10.1% | -$6.12B | 170 days |
FY2024 | $25.11B | 4.9% | 1.3% | $121.00M | 158 days |
FY2025 | $37.38B | 26.8% | 13.4% | $1.67B | 124 days |
Commentary: FY2025 marked a robust recovery from the severe 2023 downcycle. Revenue surged 49% YoY, operating margins expanded by over 2,100 bps to +26.8%, and Days Inventory Outstanding (DIO) successfully normalized to a healthy 124 days from the bloated 170 days peak.
Table 3: Recent Quarterly Performance (5-Quarter Trend)
| Metric | FQ2-25 | FQ3-25 | FQ4-25 | FQ1-26 | FQ2-26 |
YoY Revenue Growth | 38.3% | 36.6% | 46.0% | 56.6% | 196.3% |
Gross Margin | 37.2% | 38.1% | 45.0% | 56.0% | 74.4% |
DRAM Bit Growth (QoQ) | -High Single Digit | >20% | Low Teens% | N/A | N/A |
NAND Bit Growth (QoQ) | Modestly Higher | Mid-20s% | Mid-SD Decline | N/A | N/A |
DIO | 158 days | 139 days | 124 days | 126 days | 123 days |
Balance Sheet & Valuation Health
As of FQ2-26, Micron holds a pristine, fortress balance sheet with a record net cash position of $6.49 billion (Total Cash & Investments of $16.63B versus Total Debt of $10.14B). This cushion is critical as the company enters an aggressive capital expenditure cycle.
- NTM P/E Multiple: 10.93x (3Y Range: 4.45x to 461.36x; Median: 10.91x; 3Y Percentile: 50.8%)
- NTM EV/EBITDA: 7.61x (3Y Range: 2.84x to 12.44x; Median: 6.41x; 3Y Percentile: 60.6%)
Despite the stock’s parabolic move, its forward valuation sits near its historical three-year median, suggesting the market is still treating the company as a cyclical asset rather than a permanent AI infrastructure utility.
Part 4: Market Sentiment & Hard vs. Soft Data Scorecard
To gauge whether the positive momentum is durable or transient ahead of the print, we evaluate several information channels.
Table 4: Multi-Channel Sentiment Scorecard
| Channel | Current Tone | Trend vs. Prior | Key Evidence | Reliability |
Price Action | Bullish | Improving | Sustained outperformance against the SOXX index; trading at new highs. | High |
Events/News | Bullish | Improving | Massive $200B US capacity expansion plan and large-scale debt retirement. | High |
Management Tone | Extremely Bullish | Stable | Framing memory as a "defining strategic asset"; highlighting multi-year LTAs. | High |
Social Media (X) | Strongly Bullish | Accelerating | Viral focus on "AI hardware monopolies" and severe HBM shortages. | Medium |
Analyst Research | Bullish | Improving | Continuous consensus EPS revisions; focus on 12-layer HBM4 roadmaps. | High |
Overall Verdict: Bullish — Confidence Level: High
The Technical vs. Fundamental Disconnect
A moderate sentiment disconnect exists between Technical Indicators (Hard Data) and Fundamental Momentum (Soft/Hard Data). Technical indicators reveal that MU is currently as overbought as it has been in nearly three decades. Conversely, fundamental analysts continue to raise price targets based on widening physical supply deficits.
- Actionability: This setup suggests that while the stock may experience a technical "sell the news" pullback post-print, the fundamental story remains completely intact. Technical corrections should be viewed as high-conviction accumulation entry points.
Part 5: Pre-Earnings Expectations & Guidance Modeling (June 24)
Table 5: Consensus Growth Projections
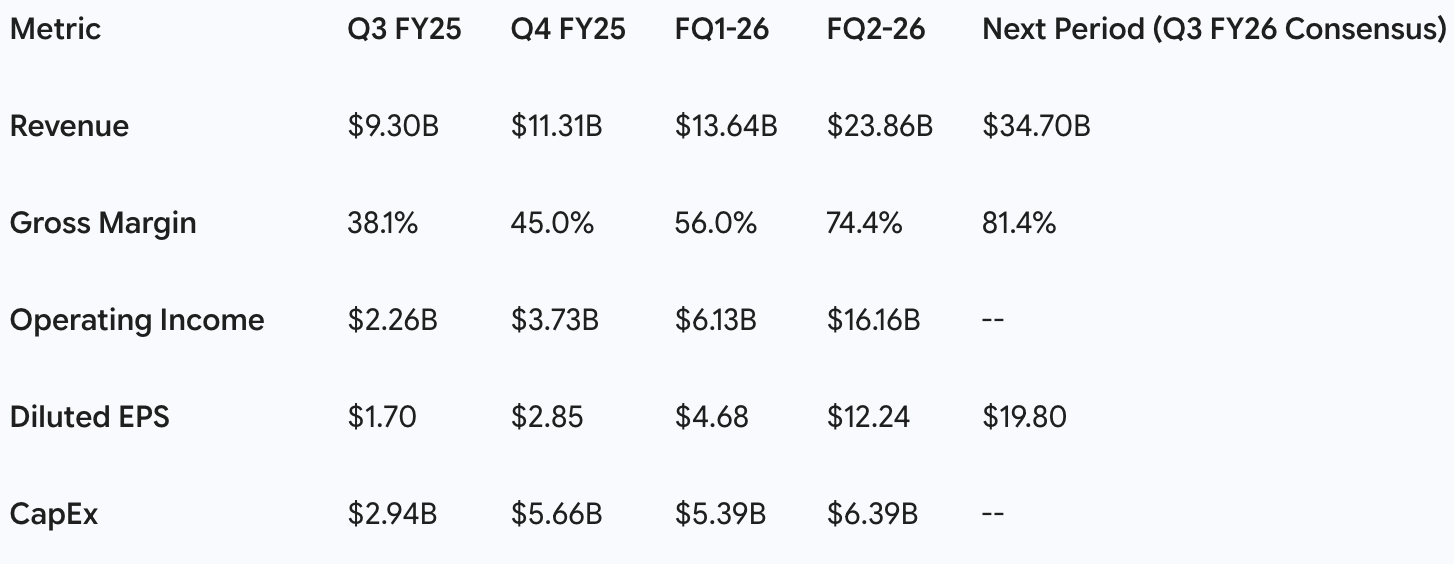
Commentary: The buy-side whisper numbers are already running hot, with the street looking for a diluted EPS print exceeding $20.01 driven by CDBU outperformance.
Management Credibility Modeling
Micron's management team has established a highly consistent pattern of conservative forecasting, beating the top end of their own guidance for four consecutive quarters. Based on historical data, we adjust current consensus expectations to model the actual expected print:
- Revenue Guidance Style: "Sandbagging" (Average Delta: High) -> Adjust expected revenue upward by +$1.2B to $35.90B.
- Gross Margin Guidance Style: "Sandbagging" -> Adjust expected gross margin upward by +40 bps to 81.8%.
- EPS Guidance Style: "Sandbagging" -> Adjust expected diluted EPS upward by +$0.65 to $20.45.
Part 6: The Core Strategic Debates
Debate 1: Structural vs. Cyclical Shift
- The Bull Case: The sheer physics of AI processing has permanently broken the commodity cycle. HBM is not a component; it is a highly customized, co-designed strategic asset with massive barriers to entry and multi-year pricing agreements.
- The Bear Case: Memory is ultimately still a commodity. Current high margins will inevitably trigger massive global capacity additions, causing an inventory oversupply and a severe cyclical crash by late 2027.
Debate 2: Customer Leverage & Pricing Power
- The Bull Case: Multi-year Strategic Customer Agreements (SCAs) have locked in volumes and fixed pricing, fundamentally insulating Micron's margins from short-term market adjustments.
- The Bear Case: Major cloud service providers hold the ultimate purchasing leverage and will renegotiate or delay commitments if their own AI CapEx cash burn begins to spark investor pushback.
Part 7: Tactical Playbook & Surprise Scenarios
The stock has rallied +19.4% over the last 14 days, hitting an all-time high of $1,149.43 on heavy institutional volume. This setup leaves zero room for execution errors.
The Landmines
- CapEx Burn: CapEx for FY26 is projected to cross $25 billion to support massive facilities in Idaho and New York. Any surprise guidance spike above this range could raise free cash flow concerns, despite the $6.49B net cash cushion.
- Consumer Drag: While the data center business is red-hot, the Mobile and Client (MCBU) segment saw a sharp sequential jump of 81% last quarter. If this was a one-time inventory rebuild rather than organic end-demand, any slowdown in PC or smartphone recovery will act as a margin drag.
Surprise Triggers
- The Genuine Positive Surprise: Announcement of new, multi-year fixed-price SCAs covering 50%+ of forward bit shipments, or a significant upward revision to long-term EPS power (currently modeled at $111 to $115). This would trigger a direct re-rating toward the $1,625 institutional price targets.
- The Genuine Negative Surprise: Any commentary indicating yield difficulties on the 1-gamma node, or signs that Samsung has achieved an unexpected yield breakthrough on its Nvidia qualification, which would threaten Micron's near-monopoly pricing power.
Part 8: Core Questions for the Conference Call
To evaluate the long-term durability of Micron’s pricing power, analysts should focus on these seven operational questions during the Q&A session:
- On Contract Durability: What percentage of your FY26 and FY27 HBM capacity is currently committed under long-term Strategic Customer Agreements (SCAs), and what structural protections do these agreements offer if hyperscalers experience a cooling-off period?
- On Wafer Intensity: Can management quantify the exact "wafer intensity" trade-off between HBM3E production and standard DDR5 as you ramp up your advanced 1-gamma nodes?
- On Margin Sustainability: How sustainable are 80%+ gross margins if NAND average selling prices (ASPs) begin to normalize in the second half of the fiscal year?
- On Next-Gen Nodes: What is the updated timeline for qualifying and shipping your 12-layer HBM4 on advanced foundry nodes, and how will this transition affect the capital expenditure run-rate for FY27?
- On Market Oversupply: How is Micron managing the risk of industry oversupply in the broader DRAM and NAND spot markets as global competitors aggressively increase their respective CapEx budgets?
- On Consumer Demand: Of the major sequential growth seen in the MCBU segment, how much represents sustainable consumer demand versus a temporary inventory buffer built by mobile and PC OEMs?
- On Fab Milestones: What are the specific construction and equipment-delivery milestones for the Clay, New York megafab before we reach the first commercial silicon supply in 2030?
Disclaimer: This content is generated using AI, synthesizing public data (filings, reports, news) and social media (Reddit, X). It may contain errors, inaccuracies, or hallucinations. Nothing herein constitutes financial advice. This newsletter is for informational purposes only; please consult a qualified professional and conduct your own due diligence before making any investment decisions.